Ridge Plot
Author: Ruth Hanna
This notebook demonstrates how to make overlapping kde plots (“ridgeplots”) using gpplot. The code for ridgeplots was based on the example found here: https://seaborn.pydata.org/examples/kde_ridgeplot
[1]:
import gpplot
import seaborn as sns
[2]:
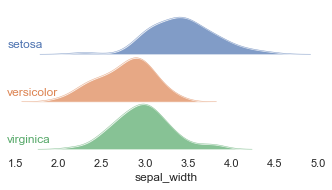
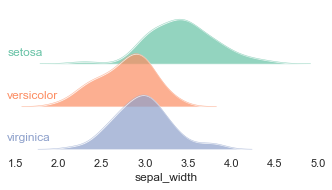
iris = sns.load_dataset('iris')
g = gpplot.ridgeplot(iris, 'sepal_width', 'species')
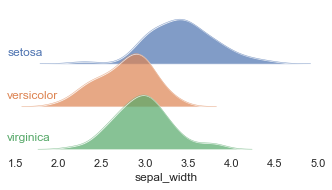
We can modify the position of the label text with the text_xpos, text_ypos, text_ha, text_va arguments.
[3]:
# Move the text to the right
g = gpplot.ridgeplot(iris, 'sepal_width', 'species', text_xpos=1, text_ha='right')

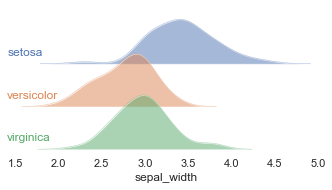
We can also change the opacity of the kde plots by changing alpha.
[4]:
# Really light
g = gpplot.ridgeplot(iris, 'sepal_width', 'species', alpha = 0.5)
[5]:
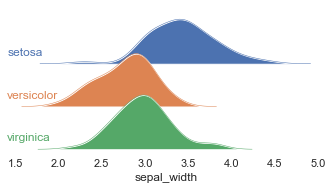
# Really dark
g = gpplot.ridgeplot(iris, 'sepal_width', 'species', alpha = 1)
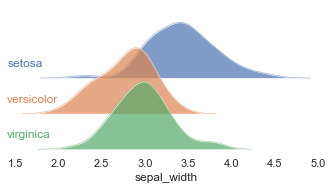
To modify the overlap of the subplots, we make changes to the FacetGrid after the ridgeplots function returns a FacetGrid.
[6]:
# More overlap
g = gpplot.ridgeplot(iris, 'sepal_width', 'species')
g.fig.subplots_adjust(hspace=-0.5)
[7]:
# Less overlap
g = gpplot.ridgeplot(iris, 'sepal_width', 'species',)
g.fig.subplots_adjust(hspace=0)
Finally, we can also supply other parameters to FacetGrid via **kwargs. For example, we could specify the order of the kde plots via hue_order and row_order.
[8]:
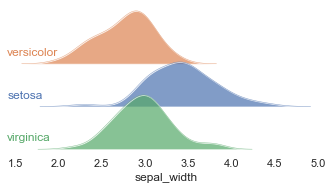
# Just changing row order keeps the colors the same
g = gpplot.ridgeplot(iris, 'sepal_width', 'species', row_order=['versicolor','setosa','virginica'])
[9]:
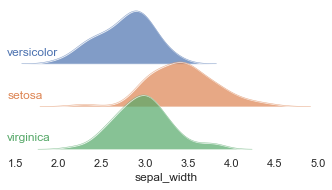
# Change the colors by also specifying hue_order
g = gpplot.ridgeplot(iris, 'sepal_width', 'species', row_order=['versicolor','setosa','virginica'], hue_order=['versicolor','setosa','virginica'])
We can also change the color palette with palette
[10]:
# Paired color palette
g = gpplot.ridgeplot(iris, 'sepal_width', 'species', palette = sns.color_palette('Paired'))
[11]:
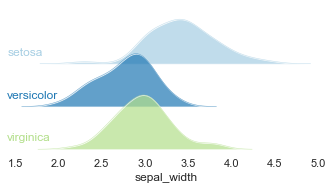
# Set 2 color palette
g = gpplot.ridgeplot(iris, 'sepal_width', 'species', palette = sns.color_palette('Set2'))
[ ]: