Density Rugplot
Here we demonstrate creating a plot where the first subplot is a distribution of values and the subsequent subplots are rugplots of values for some discrete number of variables
[1]:
import seaborn as sns
import gpplot
[2]:
data = sns.load_dataset('iris')
fig, ax = gpplot.density_rugplot(data, 'petal_length', 'species', ['setosa', 'virginica'])

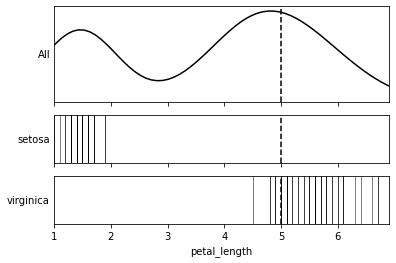
We can add a reference line across all plots
[3]:
fig, ax = gpplot.density_rugplot(data, 'petal_length', 'species', ['setosa', 'virginica'], ref_line=5)
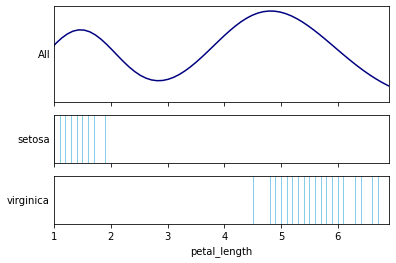
We can change the color and opacity of the rugplot lines
[4]:
fig, ax = gpplot.density_rugplot(data, 'petal_length', 'species', ['setosa', 'virginica'],
                                 density_color='navy', rug_color='skyblue', rug_alpha=1)
We can pass key word arguments to adjust the line style
[5]:
fig, ax = gpplot.density_rugplot(data, 'petal_length', 'species', ['setosa', 'virginica'], linestyle='dashed', linewidth=2)

[ ]: